Chart.jsラインチャート(Line)
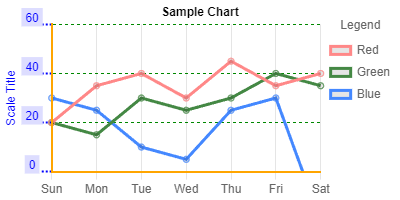
ラインチャート(Line)のサンプルです。
var ctx = document.getElementById('mychart-line');
var myChart = new Chart(ctx, {
  type: 'line',
  data: {
    labels: ['Sun', 'Mon', 'Tue', 'Wed', 'Thu', 'Fri', 'Sat'],
    datasets: [{
      label: 'Red',
      data: [20, 35, 40, 30, 45, 35, 40],
      // データライン
      borderColor: '#f88',
    }, {
      label: 'Green',
      data: [20, 15, 30, 25, 30, 40, 35],
      borderColor: '#484',
    }, {
      label: 'Blue',
      data: [30, 25, 10, 5, 25, 30, -20],
      borderColor: '#48f',
    }],
  },
  options: {
    plugins: {
      // グラフタイトル
      title: {
        display: true,
        text: 'Sample Chart',
        color: 'black',
        padding: {top: 5, bottom: 5},
        font: {
          family: '"Arial", "Times New Roman"',
          size: 12,
        },
      },
      // 凡例
      legend: {
        position: 'right',
        align: 'start',
        // 凡例ラベル
        labels: {
          boxWidth: 20,
          boxHeight: 8,
        },
        // 凡例タイトル
        title: {
          display: true,
          text: 'Legend',
          padding: {top: 20},
        },
      },
      // ツールチップ
      tooltip: {
        backgroundColor: '#933',
      },
    },
    scales: {
      y: {
        // 最小値・最大値
        min: 0,
        max: 60,
        // 軸タイトル
        title: {
          display: true,
          text: 'Scale Title',
          color: 'blue',
        },
        // 目盛ラベル
        ticks: {
          color: 'blue',
          stepSize: 20,
          showLabelBackdrop: true,
          backdropColor: '#ddf',
          backdropPadding: { x: 4, y: 2 },
          major: {
            enabled: true,
          },
          align: 'end',
          crossAlign: 'center',
          sampleSize: 4,
        },
        grid: {
          // 軸線
          borderColor: 'orange',
          borderWidth: 2,
          drawBorder: true,
          // 目盛線&グリッド線
          color: '#080',
          display: true,
          // グリッド線
          borderDash: [3, 3],
          borderDashOffset: 0,
          // 目盛線
          drawTicks: true,
          tickColor: 'blue',
          tickLength: 10,
          tickWidth: 2,
          tickBorderDash: [2, 2],
          tickBorderDashOffset: 0,
        },
      },
      x: {
        grid: {
          borderColor: 'orange',
          borderWidth: 2,
        },
      },
    },
  },
});
関連記事:
 ダッシュボード(ADMIN)
  Chart.js対数チャート(Logarithmic)
  Chart.js目盛を反転(Reverse)
  Chart.js時系列チャート(Time)
  Chart.js棒チャート(Bar)
  Chart.js積み重ね棒チャート(Bar:Stack)
  Chart.jsパイチャート(Pie)
  Chart.jsドーナツチャート(Doughnut)
 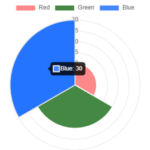 Chart.js鶏頭図チャート(Polar)
 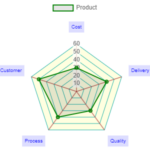 Chart.jsレーザーチャート(Radar)
 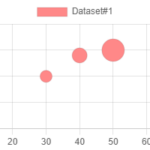 Chart.jsバブルチャート(Bubble)
 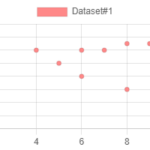 Chart.js散布図(Scatter)
 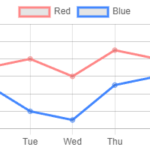 Chart.js複数軸(Multi Axis)
 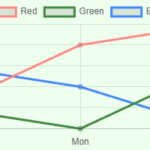 Chart.jsプラグイン(Plugin)
  Chart.jsチャートを更新する(Update)
  Chart.jsデフォルト値を変更する
  Chart.jsインストール
  Chart.jsサンプル
  Chart.jsパラメータ
  Laravel-AdminLTEインストール
  Laravel-AdminLTEとlivewireインストール
  PHP-AdminLTEインストール